In this walkthrough, we will show you how you can use an existing Lanteria HR Power BI template to change an existing dataset and build flexible visualization in the form of a chart. We will use the Release_AbsencesV2.pbix template, to which the LanteriaHR.Countries table will be added from the ESDB_* database to build a chart that shows company absence statistics by country.
Note
Prior to using the Lanteria HR Power BI templates for building Power BI reports, ensure that the preliminary setup is performed both in Lanteria HR and on the Power BI side.
To build a Company Absence Statistics by Country chart using the Absences template
- In Power BI Desktop, open the required Lanteria HR Power BI template. In this case, it's Release_AbsencesV2.pbix.
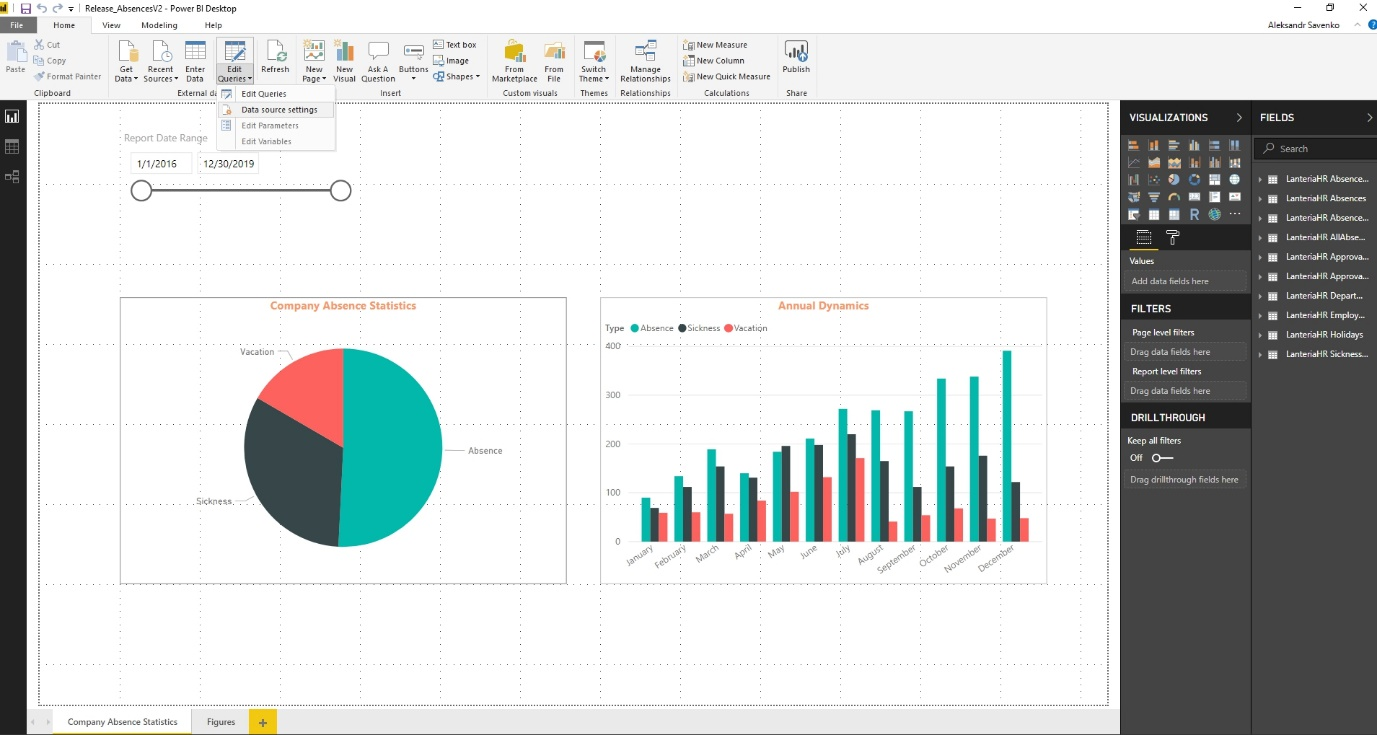
- Click Edit Queries > Data source settings.
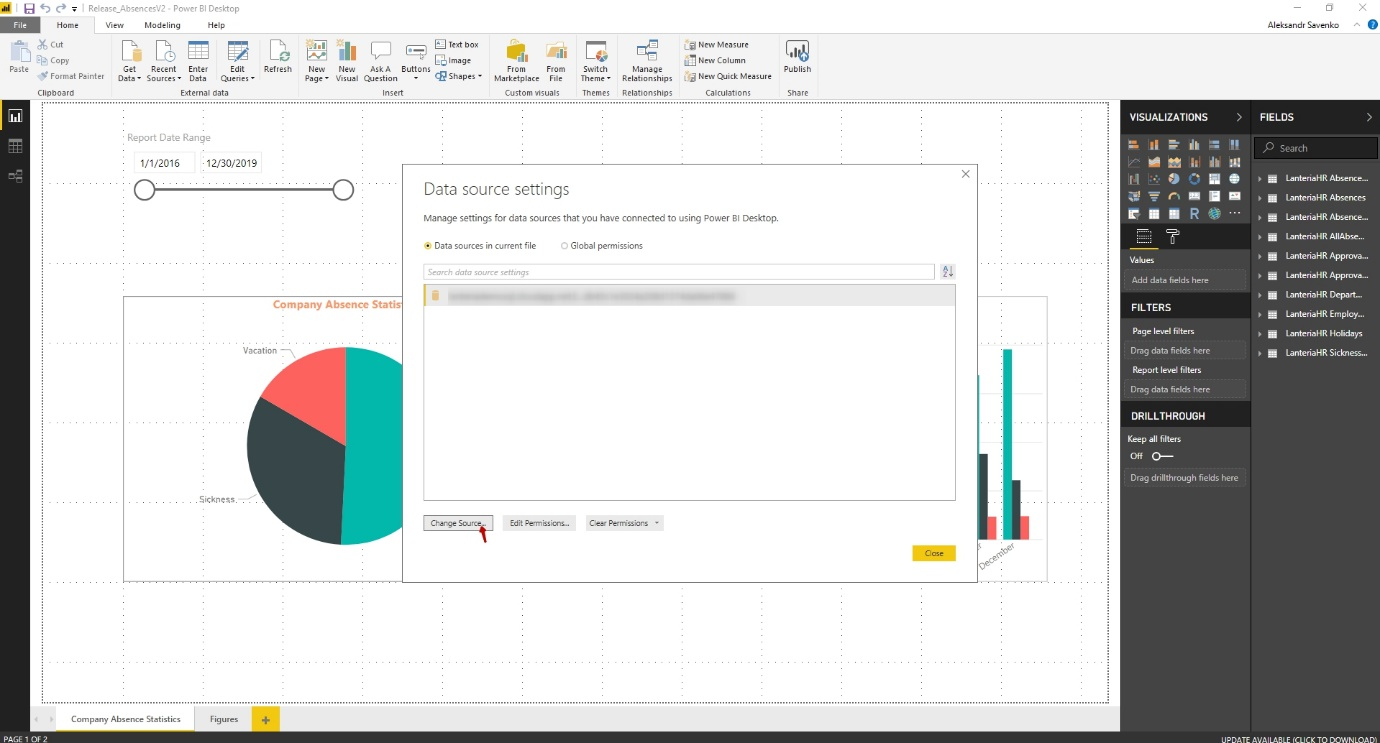
- In the Data source settings dialog window, click Change Source.
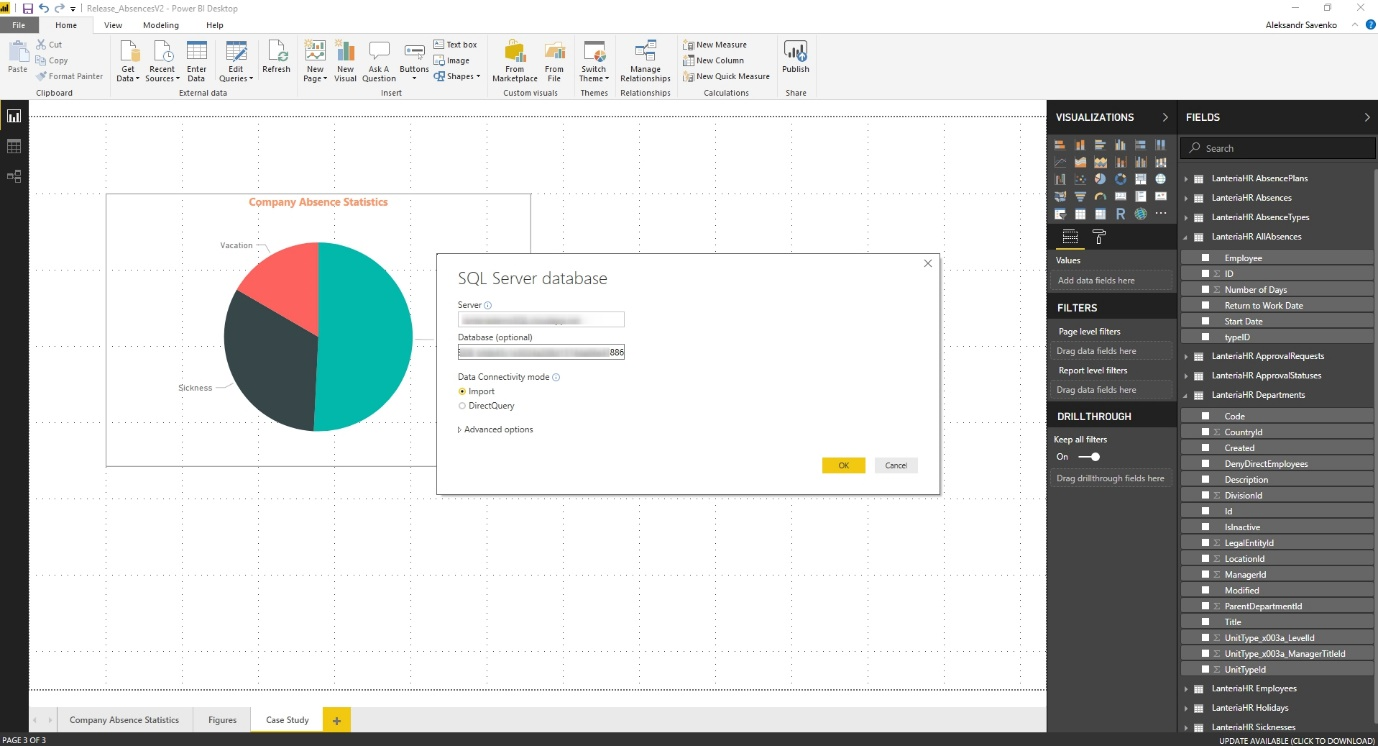
- Specify the name of the SQL server and database that stores the Lanteria HR data for Power BI (it starts with ESDB_), and then click OK.
- To finalize the change of the data source, click Apply Changes.
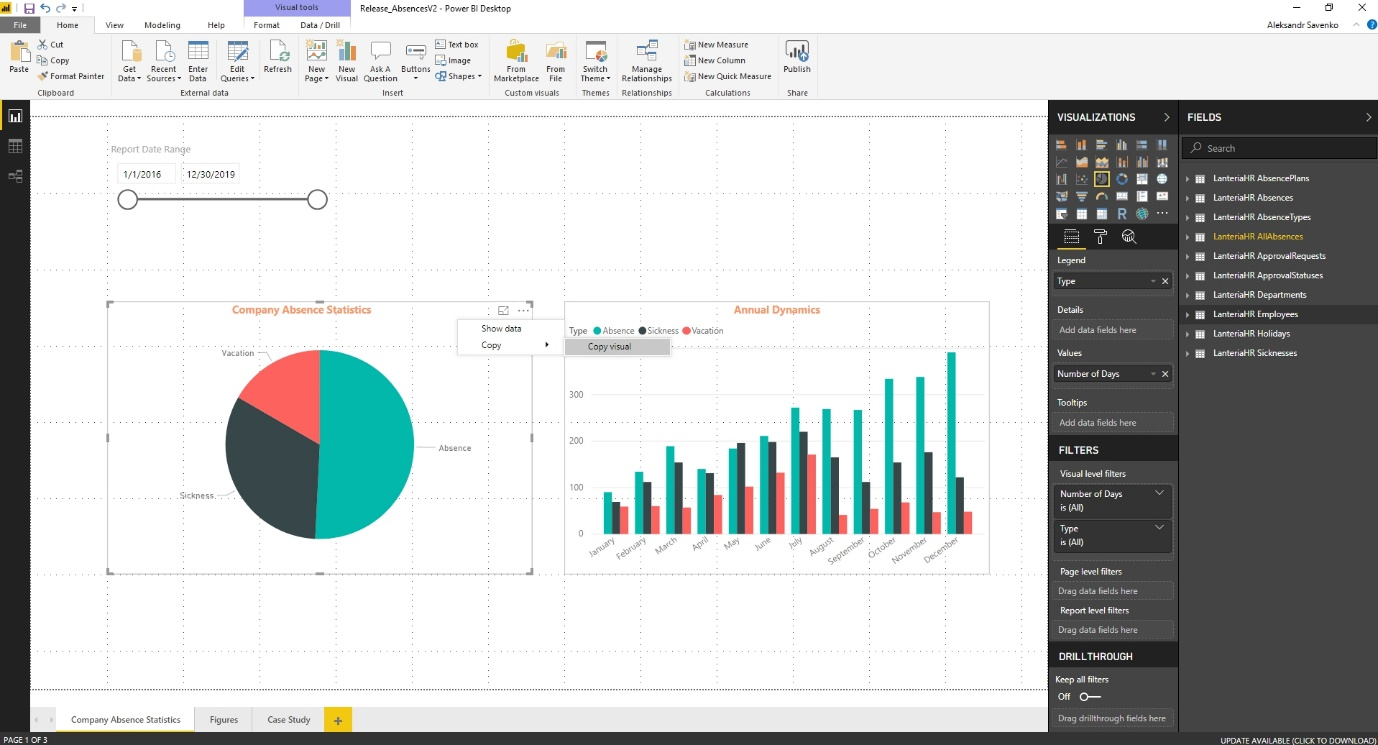
- Right-click on the existing Company Absence Statistics chart, and then click Copy Visual.
- Create a new page for the chart by clicking the
.png) icon at the bottom of Power BI Desktop, and paste our existing chart to the new page (CTRL+V or right-click > Paste).
icon at the bottom of Power BI Desktop, and paste our existing chart to the new page (CTRL+V or right-click > Paste).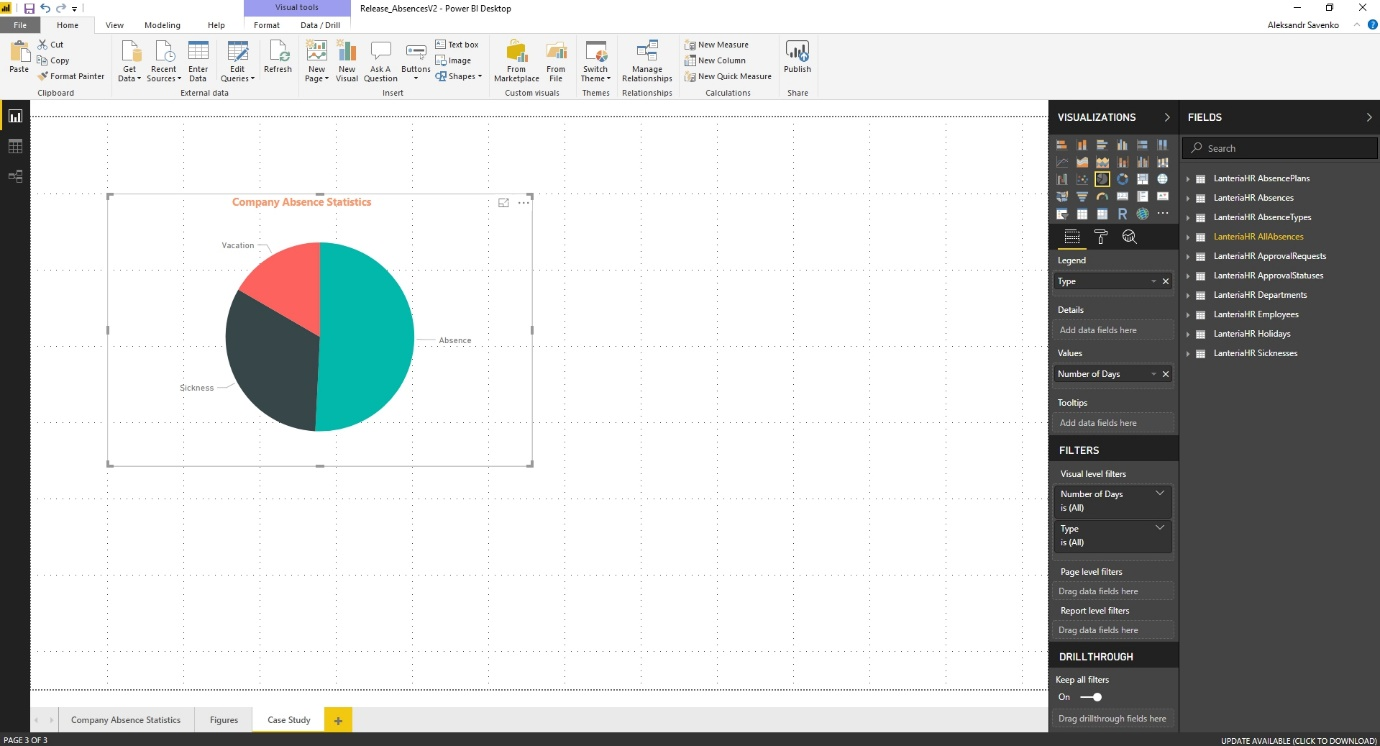
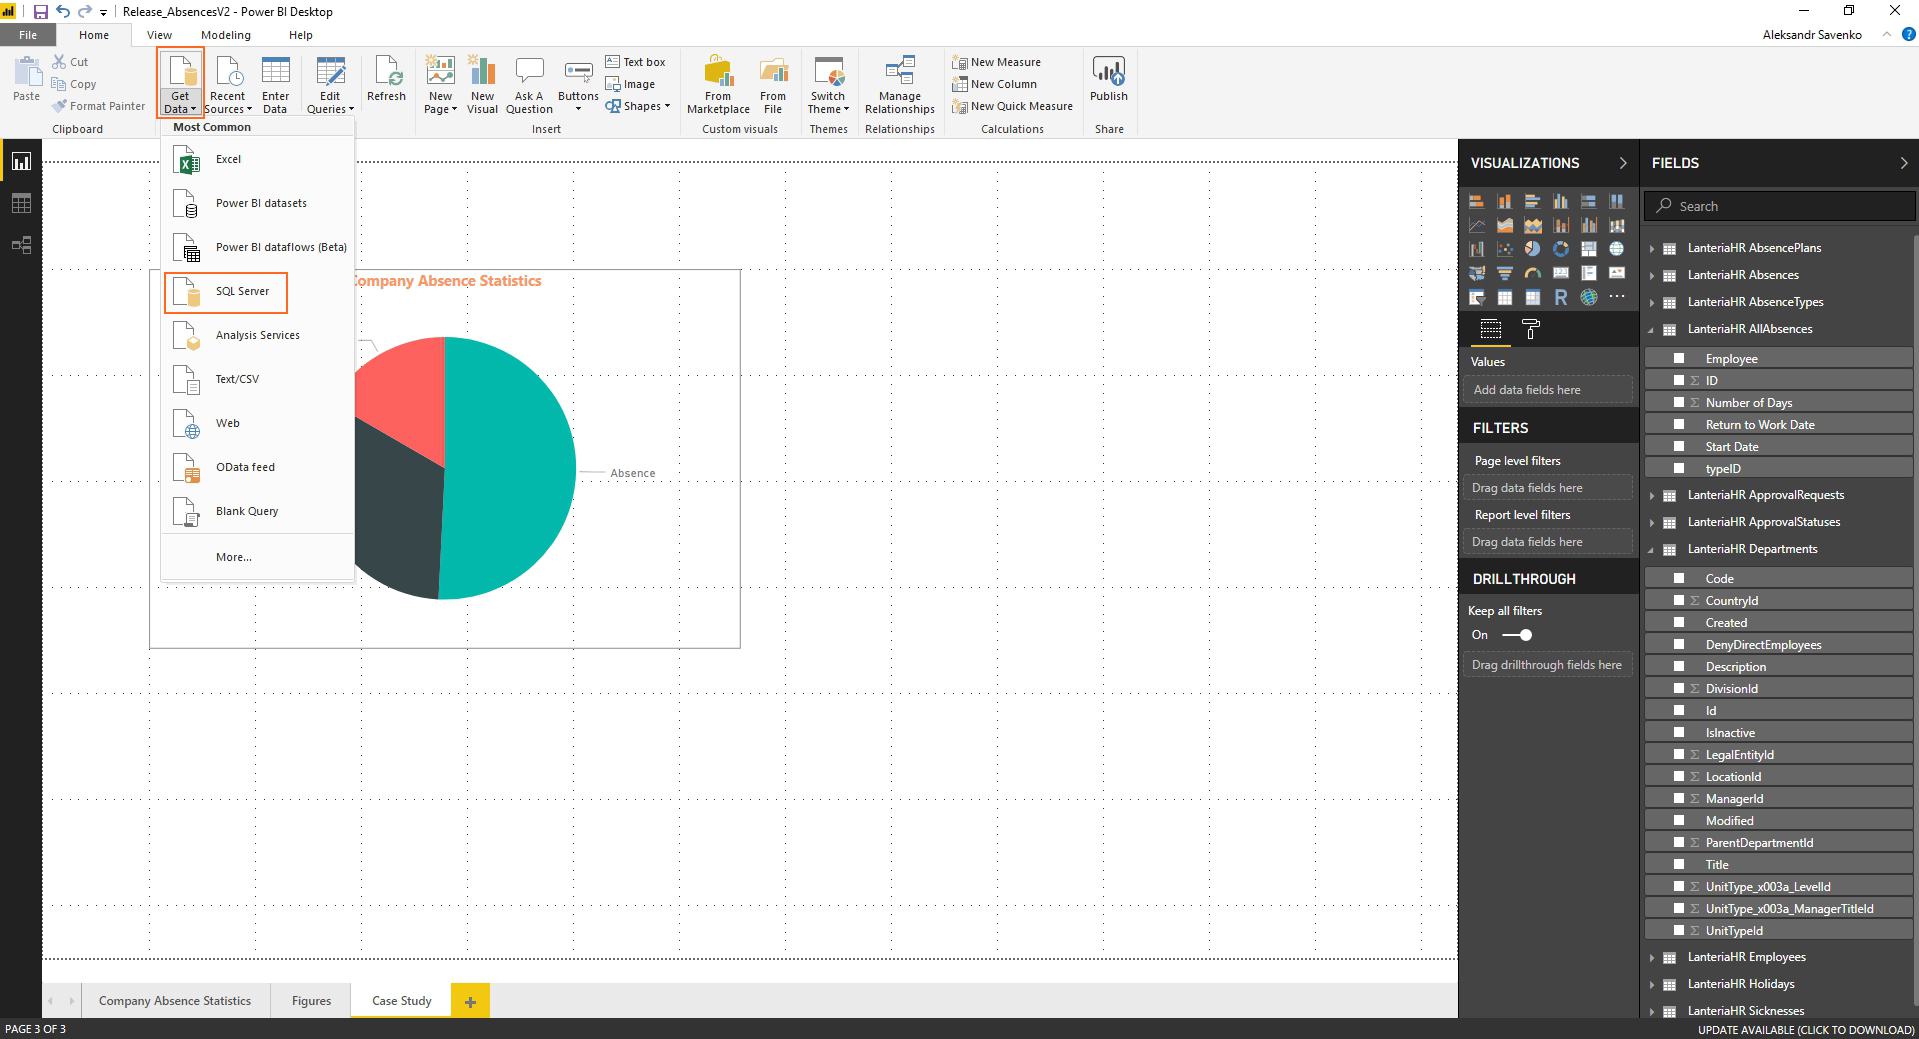
- Click Get Data > SQL Server.
- Specify the SQL Server and database, select the type Import, and then click OK.
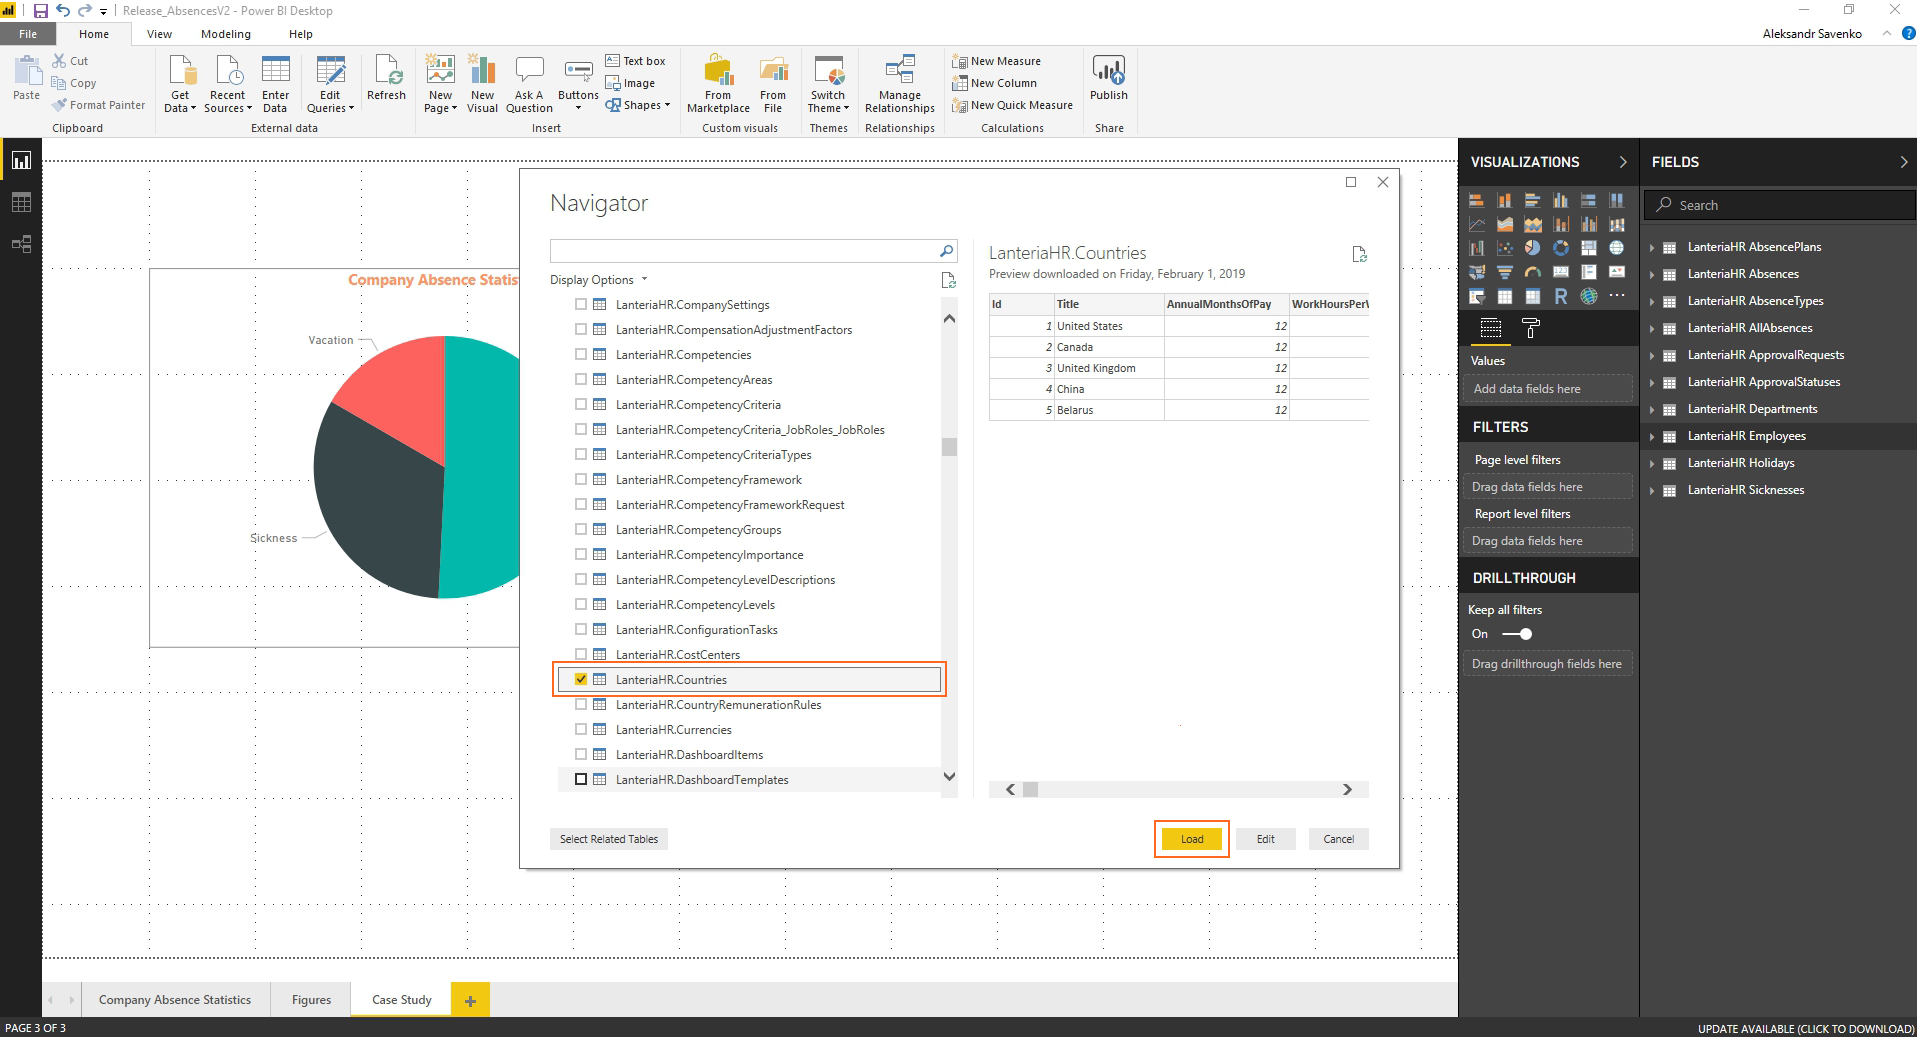
- To import new data, select a table or view from the list (in this case, we're selecting the LanteriaHR.Countries table), and then click Load.
- In the left pane, click the Relationships
.png) icon, and ensure that the table relationships are correct.
icon, and ensure that the table relationships are correct.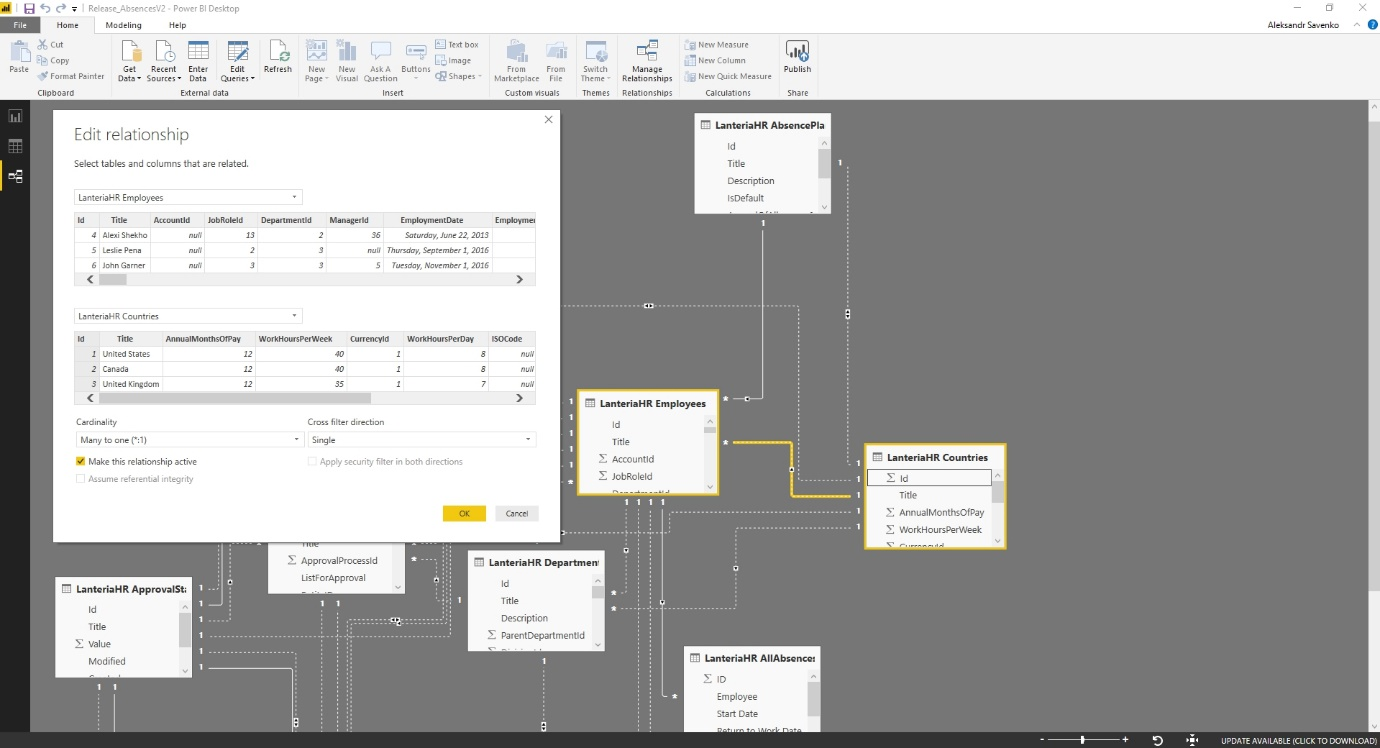
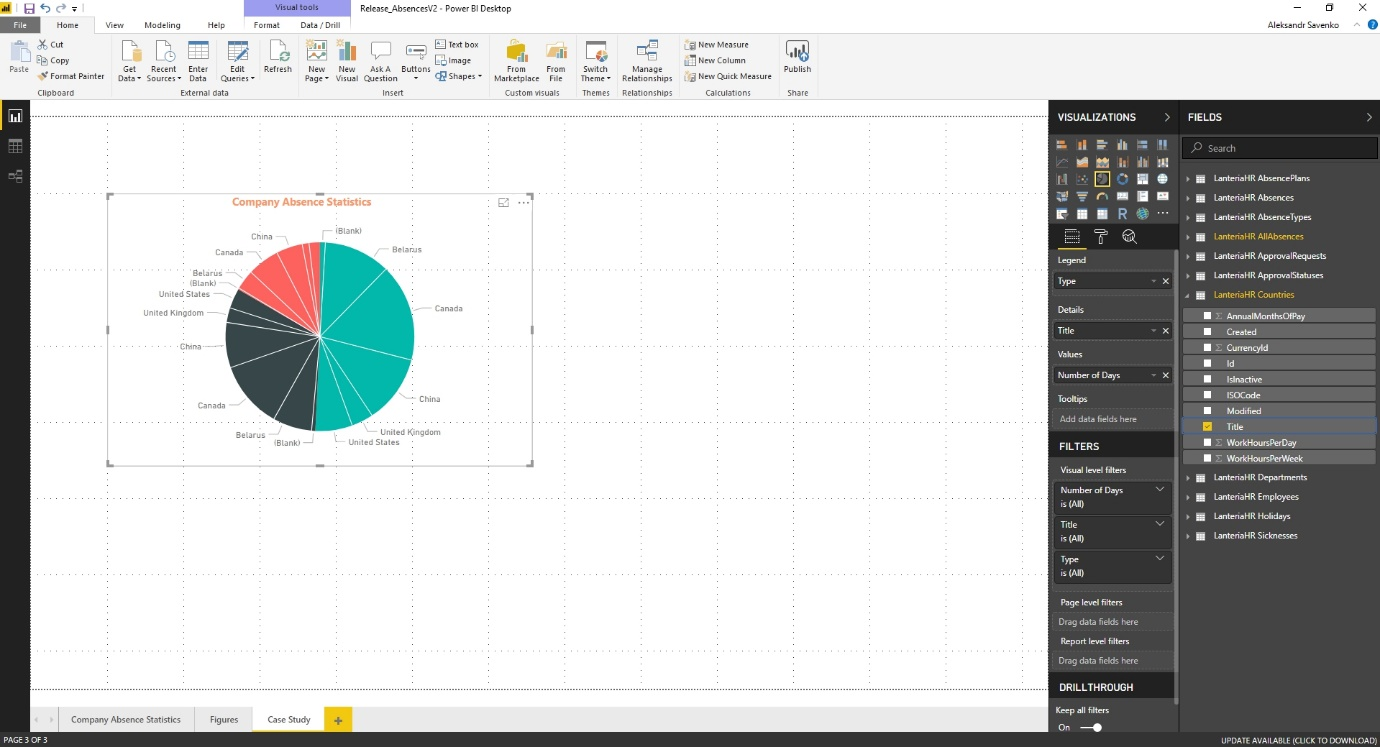
- After the table is loaded, use its data for building custom visualizations (in this example, we took Lanteria HR Countries.Title as Details for the existing chart).